THE WEATHER MAP
Well before we had weather maps we had experience which led to old wives tales; remember that “Red Sky at night, Shepherds delight” was one of those?
Think about why it came about and the implications concerning those shepherds.
Science has taken a role in the development of knowledge which we can use to our advantage.
Remember rule one! We cannot YET change the weather, and activities especially in the UK are Weather dependent.
The Science of weather is NOT EXACT!
Where do we get the Info? Weather stations all around the world. They get it from recording data from fixed sites, free balloons are released carrying radio Sounds and then share the data with other units. Computer links and programs speed the process around the world.
The old TV weather chart seems to be a thing of the past and the new generation of computer graphics is not all it’s cracked up to be.
Training and knowledge can keep you ahead of the game so it’s worth knowing what a cold front is and what it means to you whether you are an aviator, golfer, sailor or just having a picnic.
Let’s start with the way the weather develops.
Moisture in air makes it lighter, (less dense) (yes! Water molecules are smaller and lighter than the other gases they replace);
Warmer air is lighter (hot-air rises, doesn’t it?)
So warm, moist air is much lighter than the same amount of cold, drier air.
Warm, moist air exerts less pressure since it is lighter.
Cool, dry air exerts more pressure since it is heavier.
Pressure regions around the globe are defined as High pressure or Low pressure.
1013.2 hectopascals (hPa), or 29.92 inches if you are dealing in old money or are American, is called a Standard pressure.
The hectopascal is the same size as the ‘old’ millibar, so no need to change the number, luckily.
A “High” pressure area is simply higher than the surrounding air pressure, and a “Low” is simply at lower pressure than the surrounding air.
The relative imbalance of pressure causes air to flow from high to low pressure, which produces a wind!
Big fall in pressure makes a big wind such as in a typhoon.
The area of Low pressure is called a Depression.
Remember that “Depressing” is bad and so is the weather.
Looking on a weather chart lines of pressure are usually marked at 2 hectopascals (hPa) between each line.
If you see a map with lots of lines on then there is a big Low, or as we learnt … Depression, so the weather is bad.
The other situation is a map with few lines….less of a pressure gradient and the weather can therefore be described using the term SET FAIR!
With High pressure in Europe the skies are clear with few clouds. In simple terms you get a nice clear summer’s day, or a cold crisp winter’s day.
Climatology is another branch of the science of weather so I will not delve too far into that. Let’s just hint that different things can mean the same, Typhoon and Hurricane are the same deal, they just happen in different regions of the world. So moving on ….. As the adverts say better call your local HSBC branch for local info.
In a Depression ….Bad weather brings clouds. The clouds are formed when differing lumps of air meet up.
A cold air system from the Arctic meeting with warm tropical air will force the hot air to rise….condensation takes place and the more water vapour in the air, the more clouds are formed.
So before we get too heavy on this topic here’s a tip:-
In general, weather systems in the Northern Hemisphere move from West to East due to the Earth’s rotation.
Common sense tells us that what Ireland gets is usually coming our way soon.
Conditions
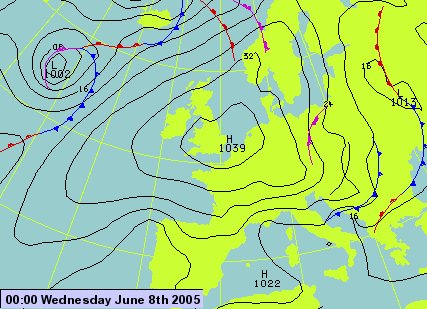
High pressure over most of the UK (1039 mb is very high for summer), which means ‘heavy’ dry air;
Widely-spaced lines (isobars) so light winds;
‘Heavy’ air so it gets stagnant and may become hazy;
Not much cloud so hot weather in summer, and frosty winter nights with lots of stars visible.
But wait a bit – what’s that out to the West, where our weather comes from? That ‘thumb-print is a depression. Enjoy the dry weather while it lasts! If we are lucky the High pressure will push it North of Scotland.
Thanks very much to the Met Office for the picture.
You can get these Met Office Aviation charts free from the web. They also have other aviation weather forecast information.
You have to register with a user name and password as normal, but it’s free. Click on http://www.met-office.gov.uk/aviation/
Youth and Education Support (YES) is not responsible for the content of external Internet sites, and if you do decide to download anything from a link PLEASE ASK THE OWNER of the computer first.